
Often while exploring a new dataset in Clojure I use the excellent
Incanter library.
Incanter is a R-like platform for statistical analysis written
in Clojure.
Now Clojure, on its own, is very powerful and very well suited to process and transform data as it includes a large number of data-processing functions on its core.
Incanter combines the power and flexibility of Clojure with a number of ready-to-use statistical functions and a simple way to plot charts using JFreeChart. Emacs + CIDER is the primary development IDE in Clojure-land, and if you have done any development at all in Clojure, the idiomatic way to do it is via REPL interaction.
So following the Incanter’s Getting Started guide you can create a project and fire up a REPL with Emacs with the following steps:
lein new try-incanterThen open the try-incanter/project.clj file and add the Incanter dependency:
(defproject try-incanter "0.1.0-SNAPSHOT"
  :description "FIXME: write description"
  :url "https://example.com/FIXME"
  :license {:name "Eclipse Public License"
            :url "https://www.eclipse.org/legal/epl-v10.html"}
  :dependencies [[org.clojure/clojure "1.7.0"]
                 [incanter "1.5.6"] ;; just added incanter dep
                 ])
Now you are ready to start the Clojure’s REPL with C-c M-j (or M-x cider-jack-in).
Once the REPL is ready a buffer will popup with the following content:
;; Connected to nREPL server running on port 59077 on host localhost - nrepl://localhost:59077
;; CIDER 0.11.0 (Bulgaria), nREPL 0.2.12
;; Clojure 1.7.0, Java 1.8.0_45
;;     Docs: (doc function-name)
;;           (find-doc part-of-name)
;;   Source: (source function-name)
;;  Javadoc: (javadoc java-object-or-class)
;;     Exit: C-c C-q
;;  Results: Stored in vars *1, *2, *3, an exception in *e;
;; ======================================================================
user>
At this point you are ready to hack on your data.
For example open the file src/try_incanter/core.clj and require a few Incanter’s namespaces and let’s plot something:
(ns try-incanter.core
(:require [incanter.core :as i]
[incanter.stats :as s]
[incanter.charts :as p]))
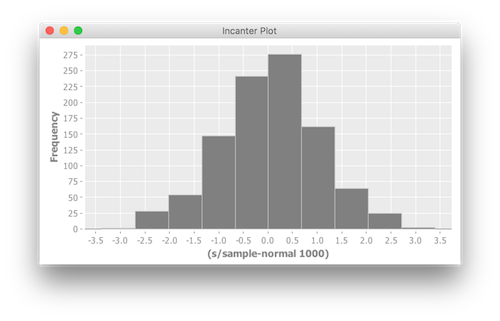
(i/view (p/histogram (s/sample-normal 1000)))If you evaluate this buffer with C-c C-k it will create a new window
on your desktop with a chart which looks as follow:
Annoyingly this popup (on a Mac) appears in the background, so you have to look for it and after a number of chart-plotting-steps your desktop might look just like this:
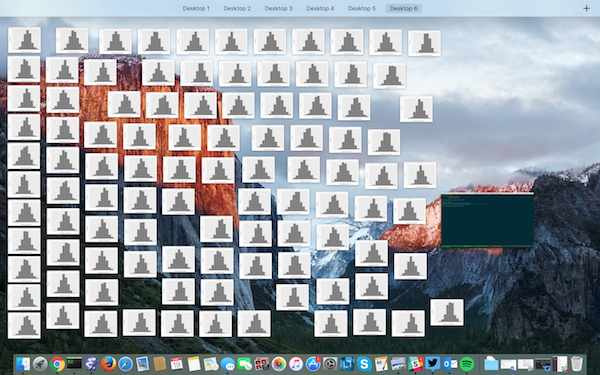
The continuous swapping between windows is irritating because you lose the REPL-momentum. One of the advantages of working with Emacs is that it is extensible in ways no other IDE system is. What I wanted was to be able to plot a Incanter chart and see the result directly in Emacs.
To achieve this, the first step is to render the chart into an image
and save it into a file. Add the following lines in your
src/try_incanter/core.clj and evaluate it (C-c C-c).
(defn show [chart]
  "Renders a chart and saves the result in a temp file"
  (i/save chart "/tmp/chart.png" :width 700 :height 500))
If we replace the i/view function with our own show function,
rather than creating a new popup, a file will be created in your temp
folder called /tmp/chart.png.
;; before
;; (i/view (p/histogram (s/sample-normal 1000)))

;; after: note we just replaced `view` with `show`
(show (p/histogram (s/sample-normal 1000)))
To be able to see image we need to hack a bit on Emacs. Open your
*scratch* buffer (or your ~/.emacs.d/init.el file) and add the
following lines.
;;
;; Incanter eval and display chart
;;

(require 'cider)
(setq incanter-temp-chart-file "/tmp/chart.png")
(setq incanter-wait-time 500)


(defun incanter-display-image-inline (buffer-name file-name)
  "Use `BUFFER-NAME' to display the image in `FILE-NAME'.
  Checks weather `BUFFER-NAME' already exists, and if not create
  as needed."
  (switch-to-buffer-other-window buffer-name)
  (iimage-mode t)
  (read-only-mode -1)
  (kill-region (point-min) (point-max))
  ;; unless we clear the cache, the same cached image will
  ;; always get re-displayed.
  (clear-image-cache nil)
  (insert-image (create-image file-name))
  (read-only-mode t))

(defun incanter-eval-and-display-chart ()
  "Evaluate the expression preceding point
   and display the chart into a popup buffer"
  (interactive)
  (let ((old-buf (current-buffer)))
    (condition-case nil
                    (delete-file incanter-temp-chart-file)
                    (error nil))
    (cider-eval-last-sexp)
    (sleep-for 0 incanter-wait-time)
    (incanter-display-image-inline "*incanter-chart*" incanter-temp-chart-file)
    (switch-to-buffer-other-window old-buf)))

(define-key cider-mode-map
    (kbd "C-c C-i") #'incanter-eval-and-display-chart)
Here it’s where the magic happens. Evaluate this buffer with C-c C-b
(or M-x eval-buffer) and go back to your Clojure file
src/try_incanter/core.clj. By pressing C-c C-i at the end of the
following like a new buffer with the resulting image should be visible
directly inside your Emacs.
(show (p/histogram (s/sample-normal 1000)))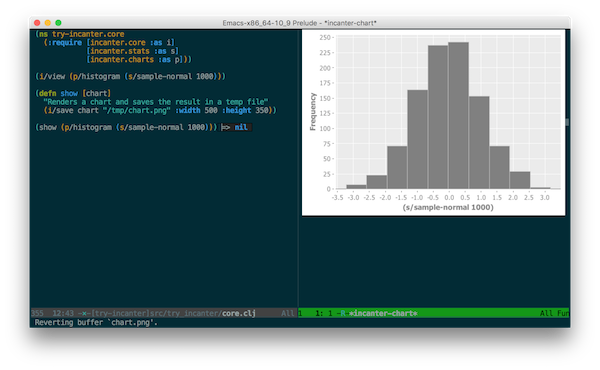
No more annoying windows appearing, no more switching, you can code and explore your dataset directly from Emacs.
Conclusions #
This solution isn’t certainly a “clean” solution but just a “hack” to make my daily working routine with Incanter running a little smoother.
There are several other solution which I’ve also tried before hacking this one. I’ve used the excellent Yeldbot Vizard plotting library which I particularly like for its simplicity and easy REPL integration, however the number of supported charts is still quite small and it requires to transform the dataset from the Incanter format to the format it expects.
The other solution I’ve tried is the Gorilla REPL which is a iNotebook-like REPL for Clojure. Again pretty nice solution, but it doesn’t have the full power of Emacs and CIDER. If your are predominantly developing in Emacs you probably don’t want to move out of Emacs but you are going to try to bring everything else into Emacs.
My Emacs-lisp knowledge is still very poor so maybe there are better ways to do the same thing and I invite the more experienced Emacs hackers to leave a comment and suggest alternative solutions.
For example my first attempt was to render the plotted chart to a file
and open the file directly in Emacs. Because I have the
global-auto-revert-mode enabled, I was expecting that upon a image
update, the auto-revert would have kicked in and the new image
displayed; however what actually happens is that the image disappears
and the binary content of the new image is displayed instead.
Happy hacking to everyone.
Updates:
- [2016-06-15] Fix emacs script to preserve cursor’s position. Thanks Yury.