
Originally posted at: https://engineering.thetrainline.com/
At Trainline we use AWS Lambda 1 in conjunction with API Gateway 2 for some of our microservices. Different teams use different languages, but in the Data Engineering team we use Clojure 3 - which is a JVM based functional programming language. Here we share some of the experiences we’ve had developing and deploying REST based APIs using JVM based Lambdas.
Although we normally use Clojure, in this blog post we will present a Java based example (for the benefit of a wider audience). However, we expect that the same results would apply to all JVM based languages (Clojure, Scala, Groovy, etc.)
This post is split into two parts. The first part describes our experience building REST services with API Gateway + Lambda, while the second part dives deeper into the usage of JVM languages for Lambda development.
We will explore the implication of using AWS Gateway and AWS Lambda for microservice development, and we will present our measurement of the added latency.
In our Lambda example we go beyond the simple single-thread request processing pattern and we leverage the full power of a naturally multi-threaded environment such as the JVM. Although this might not be the standard way to develop AWS Lambda we believe it is important to gain a deeper understanding of JVM based Lambda implementation.
We will show with empirical evidence that the JVM is subject to a freeze/thaw cycle in which all threads are temporarily frozen while the Lambda is not processing a user request. As for the previous part we will also explore implication of this behaviour.
The technology choice has to take into account many different factors such as: speed of which you can deliver the solution, security, performance, scalability, maintainability, operations, costs and the team skill-set. Balancing all these factors is a essential part of modern software development. Although, there is a number of things to keep in mind when deploying microservices with API Gateway + JVM based Lambdas, our overall experience with these solution is very positive.
Part 1: Microservices with API Gateway + AWS Lambda. #
AWS API Gateway is a great product, which provides a good deal of control and flexibility. For this reason we plan to use it in front of all microservices to leverage more serverless architecture 4. However there are a number of issues to take into account before applying this strategy.
- First and most importantly, API Gateway doesn’t run within a VPC 5, so every endpoint is exposed to the public Internet. There are a number of ways to secure endpoints, including custom authorizers and client certificates 6, however it is something that needs to be kept in mind while designing APIs.
- The second point to consider is latency. Because API Gateway exposes public APIs, it makes use of the AWS CDN CloudFront 7. Every request goes out through the customer’s VPC Internet Gateway, to some CloudFront endpoint, before making its way back to the calling service. Since we were unable to find published resources which quantify these latencies, we decided to measure them ourselves.
In this post when talking about latency we are referring to the request/response duration which includes network transfer and request processing time, unless otherwise specified.
The scenario. #
The two questions we were keen to answer were:
- What is the API Gateway latency distribution?
- What is the API Gateway + Lambda latency distribution?
In other words, we wanted to understand how much latency is added per request if we use these two technologies for our services.
To answer the first question we created the following environment:
- 1 x m4.xlarge EC2 instance with a load test tool.
- 1 x m4.xlarge EC2 instance running NGINX, serving a single static JSON file.
- Both instances were in the same region, same availability zone, same VPC, and same subnet.
The load test tool we used was Gatling 8. It is an Open Source fully asynchronous load generator. (When measuring latencies it is very important to use asynchronous load generators to avoid a common latency measurement mistake known as “Coordinated omission” 9).
Gatling simulates ramping up from 1 request per second to 100 request per second, measuring the latencies at every step. We already knew that API Gateway scales automatically to several thousands requests per second, so the objective of this test was not to see how far we could push it. Instead we wanted to measure the typical latency we can expect for the type of services we are targeting with this technology (which are low to medium traffic microservices).
Measuring latency via direct connection #
Firstly, we measured latencies when the load test tool directly calls the APIs within the same VPC and AZ. This emulates the case when two services in the same VPC and AZ communicate directly. Here we can see the results:
- Direct connection latencies over time (no API Gateway):
- Direct connection latencies over throughput (no API Gateway):
- Direct connection latency quantiles (no API Gateway):
As expected the latencies of a direct connection between two services in the same VPC / subnet are very low, and most importantly very stable. The median latency is sub-millisecond, with a very stable and low 99th percentile.
Measuring latency via API Gateway connection #
The second measurement we performed is when the load test tool accesses the service via API Gateway. This reveals how much latency overhead is added by using API Gateway.
- Proxied connection latencies over time (via API Gateway):
- Proxied connection latencies over throughput (via API Gateway):
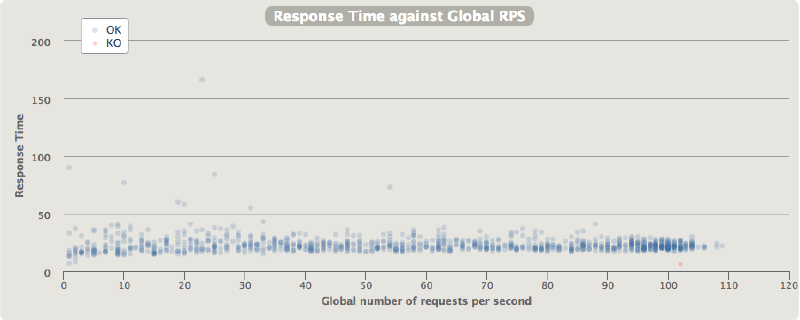
- Proxied connection latency quantiles (via API Gateway):
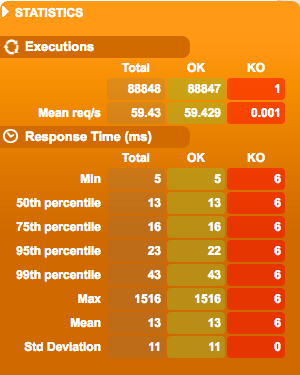
Here we can clearly see that the latency is more unstable. The added latency for every request is between 12ms and 42ms, the jitter is the in order of 10ms, and the maximum time for a single request was 1516ms. This worst case of 1.5s added on top of the typical response time is high, but luckily it doesn’t happen very often.
Measuring latency via API Gateway + Lambda #
Finally we wanted to see how much latency is added when implementing microservices as AWS Lambda functions with API Gateway on top. The test Lambda itself is trivial - it just doubles a number (code shown later). The typical execution time of the doubling code (including the request and response marshalling) is trivial; in the order of 150-200μs. Therefore all the latency reported in the following charts may be fairly attributed to the API Gateway and Lambda machinery.
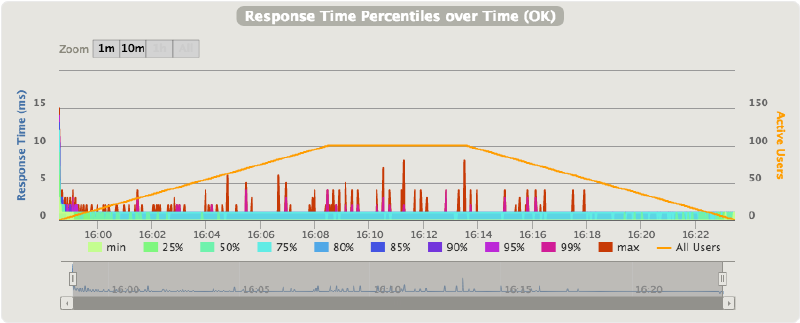
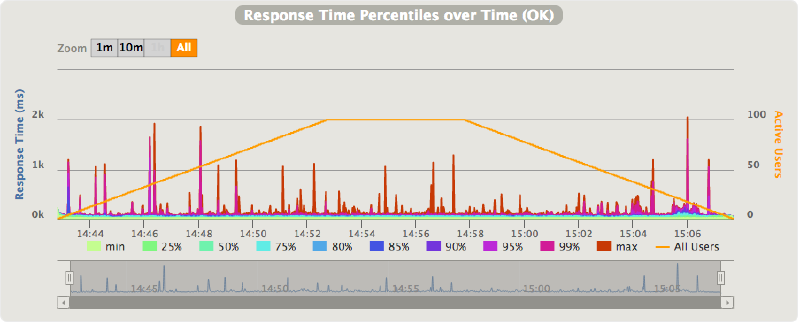
- API Gateway + Lambda latency over time:
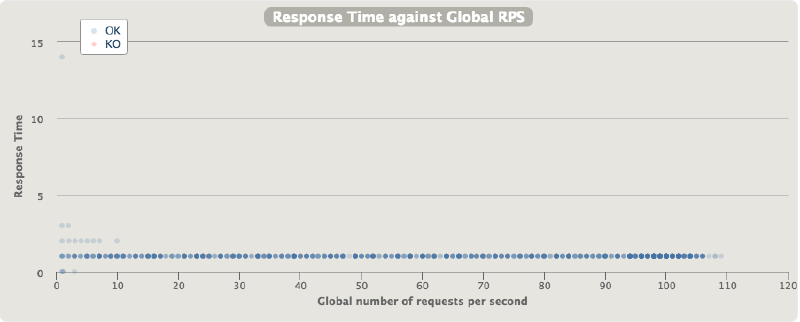
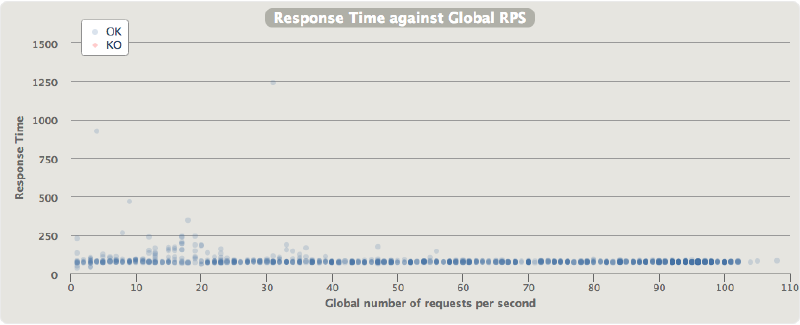
- API Gateway + Lambda latency over throughput:
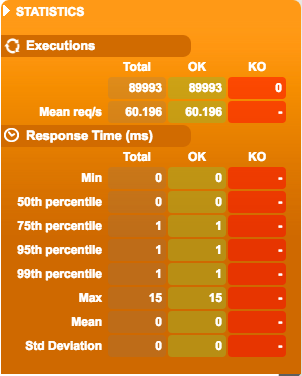
- API Gateway + Lambda latency quantiles:
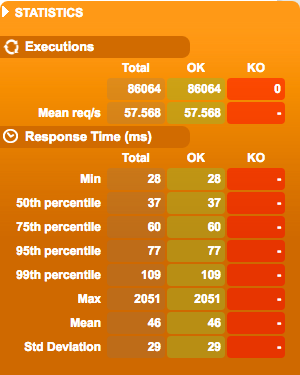
As shown here, the latencies are much higher when API Gateway and Lambda are used. Microservices implemented using API Gateway + Lambda incur a latency ’tax’ of 37-109ms per request. The wide range of latency and the high spikes are probably attributable to Lambda container creation. An interesting observation is that the latencies seems to be more jittery at lower throughput levels (15-35 requests per second). On its own, 37-109ms per request is not too bad. However, if you consider a typical microservice architecture where one frontline service makes a number of requests to other services before returning the final response, you can see how these latencies would become the dominant part of a user request, and (probably) an unacceptable overhead.
Part 2: AWS Lambdas, Java threads and the JVM freeze/thaw. #
So far we have seen some of the things to keep in mind when considering the use of API Gateway and Lambda for microservices. Now we will explore in more detail our findings around using AWS Lambda with JVM based languages. While developing a Lambda service we stumbled upon an issue which lead us to gain a deeper understanding of AWS Lambda itself.
The scenario. #
Monitoring production APIs is a standard requirement these days. AWS Lambda has a few metrics available by default in CloudWatch 10. However, if you require more detailed metrics you have to fall back on more traditional approaches and tools. At Trainline we use New Relic for most of our production monitoring, and therefore we opted to use it for monitoring Lambdas. Amongst other things, this gives us a single place to see most of our service metrics. One thing to keep in mind is that the behaviour described in this article is NOT peculiar to New Relic itself, and it will be common to any tool where metrics are published asynchronously. In fact, is not even specific to monitoring tools at all, it is just how we came about to find this specific Lambda’s behaviour. Any background operation or communication to a database or external service would suffer for the same issues we are describing in this post.
We make use of the New Relic Insights API 11, which boils down to a HTTP POST with a JSON payload containing the events and facets we wish to track.
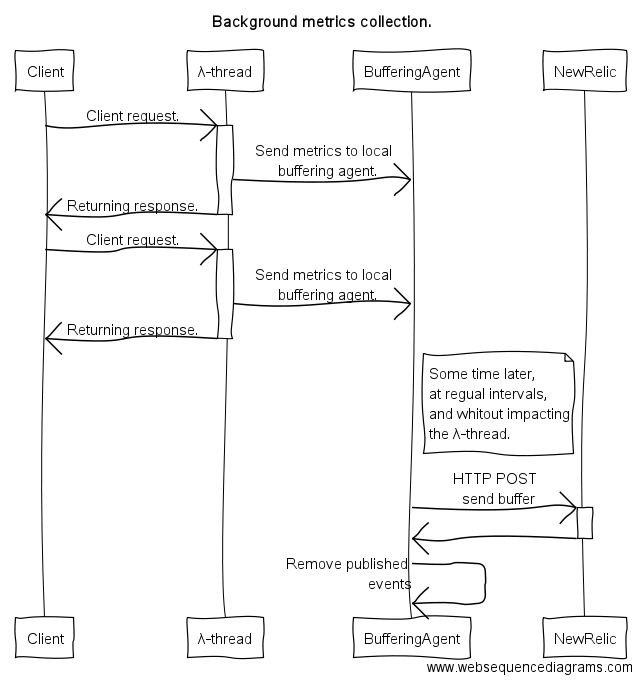
A common approach for event based monitoring like this is to buffer a number of events in memory and then use a background thread to publish the data to the tool (in our case New Relic). (In this discussion we will refer to a “background thread” as a thread which is not processing client requests). The approach has several advantages:
- it doesn’t impact the request thread. Events are passed to a dedicated thread so that the main request thread is not impacted.
- buffering. It buffers a configurable number of events in memory before making the “expensive” (100ms-120ms) request to the API.
- decoupling. The processing of the Lambda requests and the metrics collection concerns are well separated, and they have well defined failure handling modes. For example if the POST to New Relic API fails for any reason it won’t impact the request thread, and handling it could be as easy as retrying the request some time later.
The following image depict the scenario where the λ-thread and the
BufferingAgent belong to the same JVM process which is running the
AWS Lambda. The BufferingAgent runs in a background thread.
The problem. #
We found that the approach described above doesn’t work on AWS Lambda. The following section details our findings and explains why it doesn’t work.
In the main AWS documentation 12 there isn’t much detail about the Lambda lifecycle. Another blog post 13 tries to explain how containers are allocated and reused. However none of the resources we’ve found detail exactly what happens to the container / JVM once the execution of the request terminates.
What we expected is that background threads would keep working - as in a
standalone JVM - and therefore we could push the metrics to New Relic.
What really happens is that we can’t get any data into New Relic and
from time-to-time we get a SocketException with a
OperationNotPermittedException.
Once we ruled out any programming error in our code, we noticed that the same code was working correctly when the HTTP POST to New Relic was done in the Lambda request thread (synchronously), rather than in the background thread. So we started investigating how threads get scheduled in an AWS Lambda. The question we tried to answer was: “What happens to the JVM when the a Lambda request completes?”
What happens to the JVM when the a lambda request completes? #
In some of the AWS documentation and blog posts 13 we found reference to a container freeze/thaw process, but there was not enough detail to understand what is actually happening.
In order to find out how threads are scheduled in Lambda based JVMs we
did the following experiment. We wrote a simple AWS Lambda function
which, the first time it gets initialised, starts a background thread
which logs a message. It then goes to sleep for 1 second, and then
loops. The Lambda itself expects a value, and it returns the value
doubled.
Here is the sample code for the handleRequest for our FreezeThawLambda class:
    public Value handleRequest(Value request, Context context){
        log.info("request value:" + request.getValue());
        return new Value( request.getValue() * 2);
    }
And this is what the request/response POJO looks like:
public class Value {

    long value = 0L;

    public void setValue( long aValue ){
        value = aValue;
    }

    public long getValue(){
        return value;
    }

    public Value(){
    }

    public Value( long aValue ){
        value = aValue;
    }
}
When the AWS Lambda machinery instantiates our Lambda we start a background thread with this code.
    public FreezeThawLambda(){
        log.info("FreezeThawLambda created.");
        startBackgroundThread();
    }

    private void startBackgroundThread(){
        log.info("Starting background thread.");
        new Thread(){
            public void run(){
                int i = 0;
                while( true ){
                    long start = System.nanoTime();
                    FreezeThawLambda.sleep(1000);
                    long stop = System.nanoTime();
                    log.info( "background thread alive, iteration: " + ++i + " slept for: " + duration(start, stop));
                }
            }
        }.start();
    }
The full code used for this test can be found on our Github repository 14.
If this code was running on a “normal” JVM the output would look like the following:
2016-09-06 12:04:32 <> INFO  FreezeThawLambda:12 - FreezeThawLambda created.
2016-09-06 12:04:32 <> INFO  FreezeThawLambda:26 - Starting background thread.
2016-09-06 12:04:33 <> INFO  FreezeThawLambda:34 - background thread alive, iteration: 1 slept for: 1002
2016-09-06 12:04:34 <> INFO  FreezeThawLambda:34 - background thread alive, iteration: 2 slept for: 1004
2016-09-06 12:04:35 <> INFO  FreezeThawLambda:34 - background thread alive, iteration: 3 slept for: 1000
2016-09-06 12:04:36 <> INFO  FreezeThawLambda:34 - background thread alive, iteration: 4 slept for: 1003
2016-09-06 12:04:37 <> INFO  FreezeThawLambda:34 - background thread alive, iteration: 5 slept for: 1001
2016-09-06 12:04:38 <> INFO  FreezeThawLambda:34 - background thread alive, iteration: 6 slept for: 1003
As you can see, the background thread gets scheduled pretty
regularly at 1 second intervals.
Once deployed to AWS lambda and run for a few test requests, the output found in CloudWatch looks like the following:
2016-09-06 11:09:45 <> INFO FreezeThawLambda:12 - FreezeThawLambda created.
2016-09-06 11:09:45 <> INFO FreezeThawLambda:26 - Starting background thread.
2016-09-06 11:09:45 <> INFO FreezeThawLambda:19 - request value:20
2016-09-06 11:09:47 <> INFO FreezeThawLambda:34 - background thread alive, iteration: 1 slept for: 2058
2016-09-06 11:09:47 <> INFO FreezeThawLambda:19 - request value:20
2016-09-06 11:09:48 <> INFO FreezeThawLambda:34 - background thread alive, iteration: 2 slept for: 1523
2016-09-06 11:09:48 <> INFO FreezeThawLambda:19 - request value:20
2016-09-06 11:09:49 <> INFO FreezeThawLambda:19 - request value:20
2016-09-06 11:10:01 <> INFO FreezeThawLambda:34 - background thread alive, iteration: 3 slept for: 12166
2016-09-06 11:10:01 <> INFO FreezeThawLambda:19 - request value:20
2016-09-06 11:10:06 <> INFO FreezeThawLambda:34 - background thread alive, iteration: 4 slept for: 5951
2016-09-06 11:10:06 <> INFO FreezeThawLambda:19 - request value:20
2016-09-06 11:10:25 <> INFO FreezeThawLambda:34 - background thread alive, iteration: 5 slept for: 18364
2016-09-06 11:10:25 <> INFO FreezeThawLambda:19 - request value:20
2016-09-06 11:10:26 <> INFO FreezeThawLambda:34 - background thread alive, iteration: 6 slept for: 1552
2016-09-06 11:10:26 <> INFO FreezeThawLambda:19 - request value:20
The first thing to notice is that no output was sent to CloudWatch unless a request was in-flight. The first request would have instantiate the container, and after that the background thread should have been running and producing one log entry every second. However, as you can see from the logs above, the background log lines are not being emitted once per second. Instead they appear at variable intervals with irregular sleep times. The second thing to notice is that the background log lines are interleaved with the acutal request log lines. What we found is that the background thread is only emitting lines while a request is being processed.
What we think is happening - and what our experimental evidence
seems to suggest - is that after the Lambda request thread completes the
AWS Lambda machinery it freezes the JVM, and later thaws it when a new
request is incoming.
If we had to speculate about how this is happening, we would imagine that the AWS Lambda scheduler uses Linux cgroups 15 and Linux Kernel namespaces 16 to isolate lambda executions. Once the processing of a Lambda request is completed the CPU shares for the given container get set to zero. CPU shares define the amount of CPU each container is allocated to use. They are denominated as 1024 shares for each CPU core. So for example 512 CPU shares equates to half of one CPU core, while 1024 is a full CPU core, etc. We would imagine that setting it to zero would tell the scheduler to never allocate time to a given process, effectively causing the JVM to freeze. Upon a new Lambda request, the CPU shares are restored to their original value, causing the JVM process to thaw to a normal running state. Of course, this is just speculation - as AWS don’t make the Lambda internals public domain.
Although it isn’t relevant how AWS implemented their Lambda infrastructure, we think it is important to have a deeper understanding of the Lambda lifecycle so that JVM developers who want to use this service know what behaviour they can expect.
We can easily understand the commercial reasons behind the freeze/thaw process, so that AWS Lambda users are billed for the “effective” time they use CPU resources, but as JVM developers we need to consider some of the consequences:
- No progress can be made outside the request timespan by any thread. Therefore, forget about asynchronously pushing metrics to monitoring systems, and pre-fetching or refreshing internal caches.
- The JVM Garbage Collector won’t be able run minor collection in background - unless there is a running request. Similarly, the JVM Young Generation GC which is known to stop-the-world 17 will only happen when a request is being processed. In turn, it will add more latency to the request processing.
(update1)
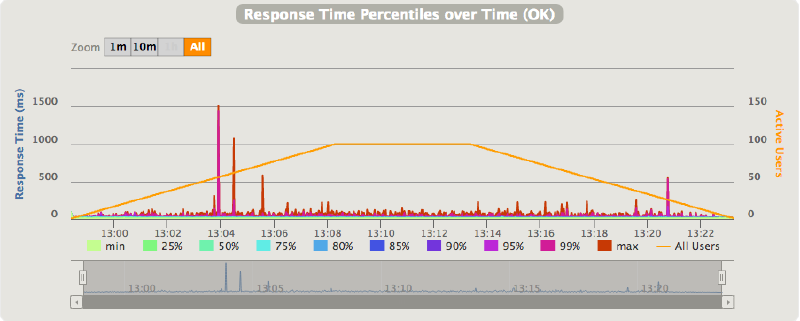
Obviously the freeze/thaw process doesn’t kick-in on every request, this would impact the latency too much. Instead, like the following measurement seems to suggest, the freeze/thaw process acts on the request’s queue length, maybe with the addition of a grace period.
As the above chart shows, at lower throughput levels the latency is more jittery, over 20-25 req/s it becomes more stable. This seems to suggest that when the request queue is empty, which it will be most of the time at lower throughput levels, then the container is frozen after the request processing is completed. Upon arrival of new requests the container is thawed back to its original state and the request is handled. At higher throughput levels the queue will be always containing new requests to process so that there is no need to freeze the container.
Bruno Bonacci
@BrunoBonacci
Data Engineering team @ Trainline.com
Many thanks to John Telford and Frederik Brysse for the early feedback and the many corrections.
References #
Updates: #
- 2017-02-04 - update1 on freeze/thaw strategy
-
https://d0.awsstatic.com/whitepapers/AWS_Serverless_Multi-Tier_Architectures.pdf ↩︎
-
https://forums.aws.amazon.com/message.jspa?messageID=647833 ↩︎
-
https://docs.aws.amazon.com/lambda/latest/dg/monitoring-functions-metrics.html ↩︎
-
https://docs.newrelic.com/docs/insights/new-relic-insights/adding-querying-data/insert-custom-events-insights-api ↩︎
-
https://docs.aws.amazon.com/lambda/latest/dg/lambda-introduction.html ↩︎
-
https://aws.amazon.com/blogs/compute/container-reuse-in-lambda/ ↩︎ ↩︎
-
https://stackoverflow.com/questions/18582827/garbage-collector-for-young-generation (Gil Tene’s comment) ↩︎